news
Georgia Tech Researchers Partner with Savannahians to Implement Data-Driven Solutions
Primary tabs
This story is supported by a grant from the Institute for Journalism and Natural Resources, and the National Association of Science Writers.
Randall Mathews has an attentive insurance agent to thank.
Part of Mathew’s job as the Assistant Director at Chatham Emergency Management Agency (CEMA) is finding and prioritizing infrastructure to inspect after a flood event, which can be time-consuming and frustrating. In Savannah, the capital of Chatham County, mandatory evacuations are rare — there were none for fifteen years between 2000 and 2015. However by 2017, mandatory evacuations in consecutive years prompted by Hurricanes Matthew and Irma reminded residents, community leaders, and emergency planners just how important it is to have access to timely assessments of hazards during a flood emergency. They could mean the difference between life or death.
In late 2017, Randall bumped into an insurance agent who had just been to a local Rotary meeting in Downtown Savannah where Dr. Russ Clark, a faculty member at the College of Computing at Georgia Tech, spoke about climate change and sea level rise. Like Mathews, Clark was also passionate about using data to improve climate resilience: his own home in the Savannah area, built only two feet above high tide, was flooded during Hurricane Irma. Concerned about the financial risk the insurance industry bears during extreme weather events, the agent begged Mathews to talk to Clark, and the rest is history.
Three years later, Mathews and Clark are co-leads of the Smart Sea Level Sensors (SSLS) team, together with Georgia Tech’s Dr. Kim Cobb and the City of Savannah Office of Sustainability director Nick Deffley. The team just published a dashboard that allows for real-time flood visualization to aid in emergency planning and response in Chatham County.
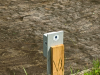
The dashboard draws data from a growing network of 52 internet-enabled sea level sensors installed near waterways and bridges within Chatham County. Designed to use mostly off-the-shelf parts and approximately the size of a shoebox, the sensors were assembled through a partnership with local students and community groups, including the Harambee House, a Savannah-area organization that works with at-risk communities to build capacity around resolving social, economic, and environmental issues.
The sensors were installed based on a number of factors, including how close they are from critical facilities such as schools and hospitals, in addition to how well they can serve vulnerable communities (Savannah is 53.9% African-American, with 21.9% of the city’s residents living under the poverty line). A dedicated engagement team, together with grad student Jorge Mario Lozano, is determining future sensor locations using a blended approach that combines algorithms analyzing federal social vulnerability benchmarks with interviews done with Harambee House.
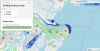
The current iteration of the dashboard includes a number of functions tailored to the specific needs of CEMA staff. Each dot represents one sensor, color-coded to indicate the level of the water at that time. A rolling line depicts instantaneous water levels, updated at least every half-hour, along with a bridge status indicator, which keeps track of water levels that come within 1 foot of a bridge.
The water level readings are fed into a model created by Dr. Emanuele Di Lorenzo, an oceanographer and Professor of Earth and Atmospheric Sciences at Georgia Tech, that interpolates the sensor data to generate a smooth layer of inundation through time. This is then overlaid on the survey areas on the map in various shades of blue by depth of water. The current modeled area (bounded by black loops) includes most of inhabited eastern Chatham county, Savannah National Historic District, in addition to the intersection between US. Routes 17 and 80.
Special significance is placed on bridges because they are often the bottlenecks in evacuation and emergency response-related activities. However, after a flood emergency, bridges are critical to recovery efforts but must be deemed structurally sound prior to being cleared for use. Bridges could have their foundations compromised after flood events, creating a hazard for fire trucks or emergency vehicles, and later, for returning residents. The state of Georgia has a limited number of bridge inspecting teams to monitor the entire coast, but there are 160 bridges in Chatham County alone; concrete data about which bridges were exposed to flooding can greatly speed operations.
Accuracy, usability, and reliability are critical for the dashboard to carry out its intended use. “We worked closely with [Mathews] over the summer of 2019 to design features and functionality of the dashboard as well as its look and feel,”said Lalith Polepeddi, a Research Scientist on the team. “We presented our designs to him each week, he gave us feedback on what he liked and didn’t like, and we would iterate.” The team’s work on the portal was funded by the Georgia Department of Natural Resources, through their Coastal Incentive Grant program.
The team took special care to benchmark the sensor data against Fort Pulaski, as a key test of accuracy, and installed two sensors alongside the NOAA tide gauge in 2019. “In the field measurements and high water marks are sometimes used as well. Some drone photography has been used,” explained Akhil Chavan, a Research Engineer on the team. The sensor data tracks Fort Pulaski data to better than 1 inch, and most of that difference can be attributed to wave activity at the surface, which introduces noise in the minute-to-minute comparison between sensors.
Going forward, the research team is working to minimize uncertainties by strategically deploying more sensors in areas that are poorly covered by the existing sensor network. In the meantime, they work to communicate the various sources of uncertainty to decision-makers. “We seek to add more bridges so we can show how far away water may be from their base beams; we seek to add more risk assessments to sensors to help emergency planners spot potentially vulnerable areas at a glance,” said Polepeddi.
The team is now implementing additional updates to a public dashboard to be made available at sealevelsensors.org. They are joined by intern Austin Ang, a Georgia Tech undergraduate student who is bringing his work with the project full circle: as a highschooler, Ang had been one of the student volunteers at Jenkins High School who had assembled the team’s first sensors and kickstarted the project.
“I joined the project because I formerly worked on the Sea Level Sensors in high school and wanted to re-contribute to the project with some of the knowledge I gained in college.” Ang says. “I am hoping to further my software engineering skills and to make a difference in my community while doing so.”


Summary
Randall Mathews and Russ Clark are co-leads of the Smart Sea Level Sensors (SSLS) team, together with Georgia Tech’s Dr. Kim Cobb and the City of Savannah Office of Sustainability director Nick Deffley. The team just published a dashboard that allows for real-time flood visualization to aid in emergency planning and response in Chatham County.
The dashboard draws data from a growing network of 52 internet-enabled sea level sensors installed near waterways and bridges within Chatham County. Designed to use mostly off-the-shelf parts and approximately the size of a shoebox, the sensors were assembled through a partnership with local students and community groups, including the Harambee House, a Savannah-area organization that works with at-risk communities to build capacity around resolving social, economic, and environmental issues.
Status
- Workflow status: Published
- Created by: sperrin6
- Created: 10/06/2021
- Modified By: sperrin6
- Modified: 10/06/2021
Categories
Keywords
User Data