news
Georgia Tech Researchers Release County-Level Calculator to Estimate Risk of Covid-19 Exposure at U.S. Events
Primary tabs
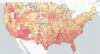
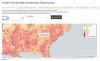
An interactive dashboard that estimates Covid-19 incidence at gatherings in the U.S. has added a new feature: the ability to calculate county-level risk of attending an event with someone actively infected with Coronavirus (Covid-19). Previously, the dashboard estimated exposure for different size events by state.
The new “Covid-19 Event Risk Assessment Planning Tool” is the work of Joshua Weitz, professor in the School of Biological Sciences and founding director of Georgia Tech’s Ph.D. in Quantitative Biosciences program, in collaboration with the lab of Clio Andris, an assistant professor in the School of City and Regional Planning with a joint appointment in the School of Interactive Computing at Georgia Tech, and with researchers from the Applied Bioinformatics Laboratory (a public/private partnership between Georgia Tech, IHRC Inc., and ASRT Inc.).
“We have developed an interactive county-level map of the risk that one or more individuals may have Covid-19 in events of different sizes,” Weitz says. “The issue of understanding risks associated with gatherings is even more relevant as many kinds of businesses, including sports and universities, are considering how to re-open safely.”
The dashboard accounts for widespread gaps in U.S. testing for the Coronavirus, which can silently spread through individuals who display mild or no symptoms of illness. “Precisely because of under-testing and the risk of exposure and infection, these risk calculations provide further support for the ongoing need for social distancing and protective measures. Such precautions are still needed even in small events, given the large number of circulating cases,” states the dashboard’s website.
For example: As of Monday, July 6, for an event with 100 attendees in Fulton County, Georgia, the estimated risk of someone in attendance being actively infected with Coronavirus is 76 percent. For that same day at an event with 1,000 attendees, the estimated risk in all but 16 of Georgia’s 159 counties exceeds 99 percent.
The dashboard’s technical development was made possible by contributions from Seolha Lee, a master’s student in Andris' group, and Aroon Chande, a Ph.D. candidate in Bioinformatics at Georgia Tech.
The dashboard’s website, which is updated daily, incorporates data from The New York Times case count and Covidtracking.com dashboard (a resource led by journalist Alexis Madrigal of The Atlantic). Both of these databases record confirmed case reports from state-level departments of public health.
“The Covid-19 Event Risk Assessment Planning Tool takes the number of cases reported in the past 14 days in each county, and multiplies these by an under-testing factor to estimate the number of circulating cases in a particular county,” Weitz explains. (In late June, Robert Redfield, director of the U.S. Centers for Disease Control and Prevention (CDC), stated on a press call that “now that serology tests are available, which test for antibodies, the estimates we have right now show about 10 times more people have antibodies in the jurisdictions tested than had documented infections.”)
Tracking tools developed earlier this year by Weitz and colleagues at Georgia Tech and other institutions are also factored into the team’s new county-level calculator. “The model is simple, intentionally so, and provided context for the rationale to halt large gatherings in early-mid March and newly relevant context for considering when and how to re-open,” states the dashboard website.
Media
Summary
The new county-level calculator builds on the team’s interactive state-level tool, which estimates the daily risk that one or more individuals infected with Covid-19 are present in U.S. events of various sizes.
Status
- Workflow status: Published
- Created by: David Mitchell
- Created: 07/07/2020
- Modified By: David Mitchell
- Modified: 05/26/2022
Categories
User Data