news
Restoring Data's Sense of Place
Primary tabs
By Michael Pearson
John Britti, a fifth-year student in computational media, used to have what he calls a “woefully average” approach to data.
“Literally average, in fact,” the Atlanta resident said. “I focused mainly on finding what was normal about the data, what the aggregate looked like.”
As Britti notes, that’s not a necessarily bad way to approach data, but it’s far from the only one. Enter Yanni Loukissas, an assistant professor in the School of Literature, Media, and Communication, who is looking to change how people view the avalanche of information that surrounds us. Britti studied with Loukissas, and found a new way to look at information that makes him a more well-rounded student.
“Yanni pushed me and my class to look at the weird extremities of data as much as the aggregate,” he said. “What’s interesting about it and does its strangeness reveal some kind of systemic abnormality in the data as a whole?”
A former architect, Loukissas is working toward a sense of place to information design, arguing for a design ethic that encourages a belief in the idea that “All Data Are Local,” which also happens to be the title of his most recent book.
“Data aren’t placeless,” he said. “We like to talk about open data, the transparency of data, which suggests that data work anywhere, that they offer these immediate insights to those who have the tools to decipher them. I offer a different view, which is that data are just a starting point, a way in.”
“What I’m suggesting is that people adopt the sensibilities of qualitative analysis to what is traditionally quantitative work with data,” he said.
For instance, while Facebook or Zillow might see data as pixels in a bigger picture, Loukissas sees data more as the index to a book.
“An index can tell you something about a book, but it is not the whole story. It’s the same with data. There are often deeper, broader sources of knowledge that lay beyond data,” Loukissas said. “Data are just the traces.”
Data Settings, not Sets
Loukissas’ work has ramifications in a variety of settings. It provides a critical framework that can be used to evaluate how big technology companies collect, package, and reuse data from millions of sources.
Loukissas is particularly critical of Zillow’s use of data because of the company’s practice of ingesting millions of property records meant to serve the needs of local tax assessors and residents. That data is then transformed through an algorithm that estimates and predicts home values, figures he says are created using data meant for another purpose and stripped of its original context.
For Loukissas’ information design students, the concept of data locality serves as a way to consider new and different techniques for presenting data. He cites the example of Bear 71, an interactive film that represents data and the context of its production to help tell the story of an ursine resident of Canada’s Banff National Park.
“It's such a great example of presenting not just the data set, but the data setting. There's so much more that's going on there than just these videos that are captured,” he said. “And you learn a lot about the relationship between the cameras, between where they're placed in the landscape, and how the story unfolds across that landscape. So it really takes seriously this idea that the setting matters. Data aren't just something to be extracted and mined for their own patterns independent of the origin.”
The Map Room
The Local Data Design Lab in the Technology Square Research Building contains the tactile representation of Loukissas’ work.
With funding from the Digital Integrative Liberal Arts Center (DILAC), four students working with Loukissas set up the the Map Room in 2018. It was inspired by the first map room, built in St. Louis by artist Jer Thorpe, now Loukissas’ collaborator.
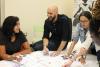
Technologically, it is simple. A sliding overhead projector displays a map onto a large sheet of craft paper rolled out across a table. Participants interact with the map by using colored markers to trace the map contours or add data on topics of interest to them: from tax assessments, to traffic, to crime, to education.
“Because it’s about place, and they live there, they’re in a position to ask, ‘Is this data aligned with my own experience and knowledge?” Loukissas said. “If not, what’s wrong? What’s missing? Is the data outdated? Is there an error? Is it reading the wrong indicator?”
The process, Loukissas says, helps participants absorb the larger lessons he is trying to impart about data: that it is not necessarily objective, or complete, and that place plays an important role in understanding what they really mean.
For Britta, working with the Map Room was illuminating.
“I think the Map Room really hits home the notion that data collection isn’t done by abstract mechanical entities,” he said. “The human touch, be it compassionate or reckless, permeates throughout. Obviously, the map room is explicitly about folk data collection, so it’s less structured by design, but I think that’s just a simple way of exposing how messy the process of data collection can be.”
Data Toolkit for Georgia Tech Students
In addition to the Map Room, Loukissas has created a data toolkit for Serve-Learn-Sustain designed to encourage students across campus to think about how they use data.
The tool encourages students to consider the data’s origins, purpose, and audience, think about how the data is structured, how it has been used elsewhere, and what ethical considerations use of the data may pose.
Loukissas also asks students to conduct an interview with someone involved in the creation, management, or use of the data to understand more about how it was created and used.
“Students are often asked to work with unfamiliar data sets, but they aren’t encouraged to see the people and places beyond the data,” he said. “I’m hopeful that this tool can help usher in a new sensibility about working with data.”
LMC is a unit of the Ivan Allen College of Liberal Arts.
Media
Summary
Yanni Loukissas, an assistant professor in the School of Literature, Media, and Communication, is looking to change how people view the avalanche of information that surrounds us.
Status
- Workflow status: Published
- Created by: kk151
- Created: 11/26/2019
- Modified By: kk151
- Modified: 11/26/2019
Categories
Keywords
User Data