image
spatial meta
Primary tabs
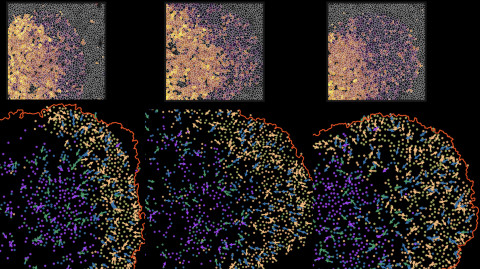
Images of time in space: The top panel image shows pseudo-time single cell metabolic trajectories across distinct biogeographical regions. The dark purple represents early metabolic changes, while the bright yellow represents later metabolic activities. The bottom panel is a spatial projection of single cells’ metabolic trajectories (denoted by arrows in the dark zone and light zone regions) in tonsil tissue. Photo provided by Coskun Lab