Skip to main content
Skip To Keyboard Navigation
Toggle navigation
Mercury (Hg)
Saturday, May 02, 2026
Navigation Menu
Content
All content
All media
Groups
Mercury Help
Search this site
image
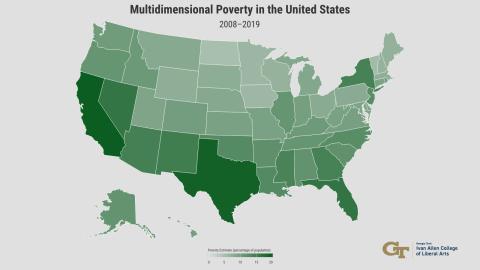
Multidimensional Poverty in the United States 2008–2019
Primary tabs
View
XML
JSON
Log in
Click here to LOG IN with your Georgia Tech account
.