image
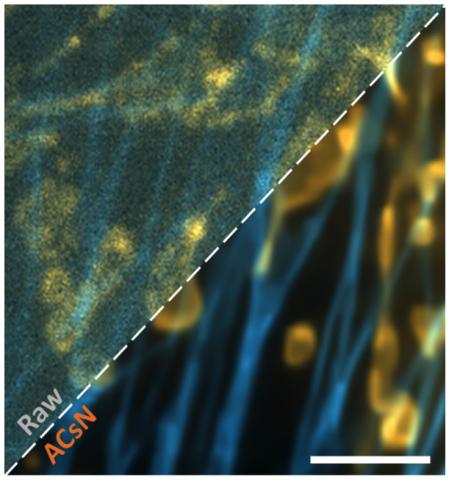
Figure: Dual-color image before and after ACsN denoising of F-actin (cyan) and mitochondria (orange) in fixed bovine pulmonary artery endothelial (BPAE) cells obtained by TIRF microscopy with an exposure time of 2 ms. Scale bar 4 um.
Primary tabs