image
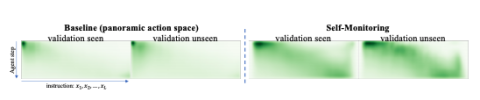
The graphs on the left represent a baseline on how well an agent is moving through a set of tasks. The two graphs on the right represent the work discussed in “Self-Monitoring Navigation Agent Via Auxillary Progress Estimation”. The darker the green is an
Primary tabs